If you book an unmoderated RapidUsertest with 7 or more testers, the Net Promoter Score (NPS) is automatically displayed in the overview on your dashboard. We explain here how to interpret it and what you can use it for.
What is the NPS?
Net Promoter Score (NPS) is a widely used metric related to business success that expresses customer satisfaction. It is collected by a wide range of companies, which allows easy comparison between them. The NPS is easy to communicate within the company, including to management.
The survey is very simple, because only one question needs to be answered:
"How likely are you to recommend the site to friends or colleagues?"
Users answer this question on a scale of 0-10, and respondents are then placed into three categories based on the value they give:
- 0-6: Detractors
- 7-8: Passives
- 9-10: Promoters
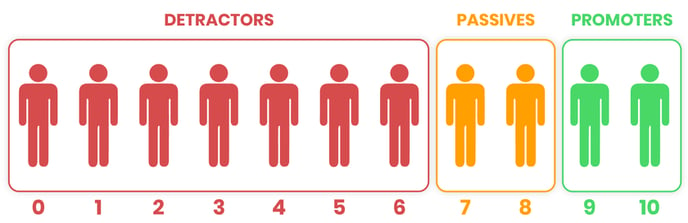
Promoters will most likely recommend your site/app to others. Detractors, on the other hand, may even talk negatively about your site.
What can you use the NPS for?
- As a benchmark to compare yourself with competitors or the average values in your industry.
- As a comparative value for multiple usability tests to see whether the score has changed since the last test, e.g. before and after a relaunch.
- In comparative tests (e.g. design comparison), it can provide information about which variant is better received.
- For comparison with your own measured values.
How is the NPS calculated?
If you subtract the percentage of detractors from the percentage of promoters, you get the NPS.
NPS = Promoters (%) - Detractors (%)
Example: 10 testers have given their verdict. 3 (30%) of them are promoters, 1 (10%) is a Detractor. Thus, the NPS is 20.
The value can therefore be between -100 and +100, with -100 being the worst and +100 the best.
What does the NPS tell you, and how do you interpret it?
Let's say your site scored 29 on a RapidUsertest. What does that mean?
In principle, all values above 0 are good, because this means that there are more promoters than detractors. The NPS varies greatly depending on the industry. For comparison: The Apple iPhone has a score of 63. A study across a wide range of industries showed an average NPS of 44. If you want to have a good comparison value, be sure to refer to your own industry. That way, you avoid comparing apples with oranges (or Apple with Toyota).
What to consider when interpreting it:
- As good as the NPS works and as easy as it is to collect, you should still not make it the sole metric for your customer loyalty, otherwise you will lose important insights.
- In most cases, the sample for RapidUsertests is quite small. That's why we only use the NPS as an indicator for customer satisfaction.
- The survey situation after a usability test can be different from the comparative values you find on the web.
- The NPS should be seen as a supplement to the result videos. The results of the usability test allow you to draw conclusions as to why the NPS is higher or lower.
Just try out the NPS during your next RapidUsertest. If you have 7 or more participants, it will be automatically displayed in your dashboard together with the test results. Have fun testing and comparing!